

Web mission control
The daemon embeds a React dashboard (Astro + React) and serves it at http://localhost:8765 alongside the REST API — no separate server required.
warden daemonopen http://localhost:8765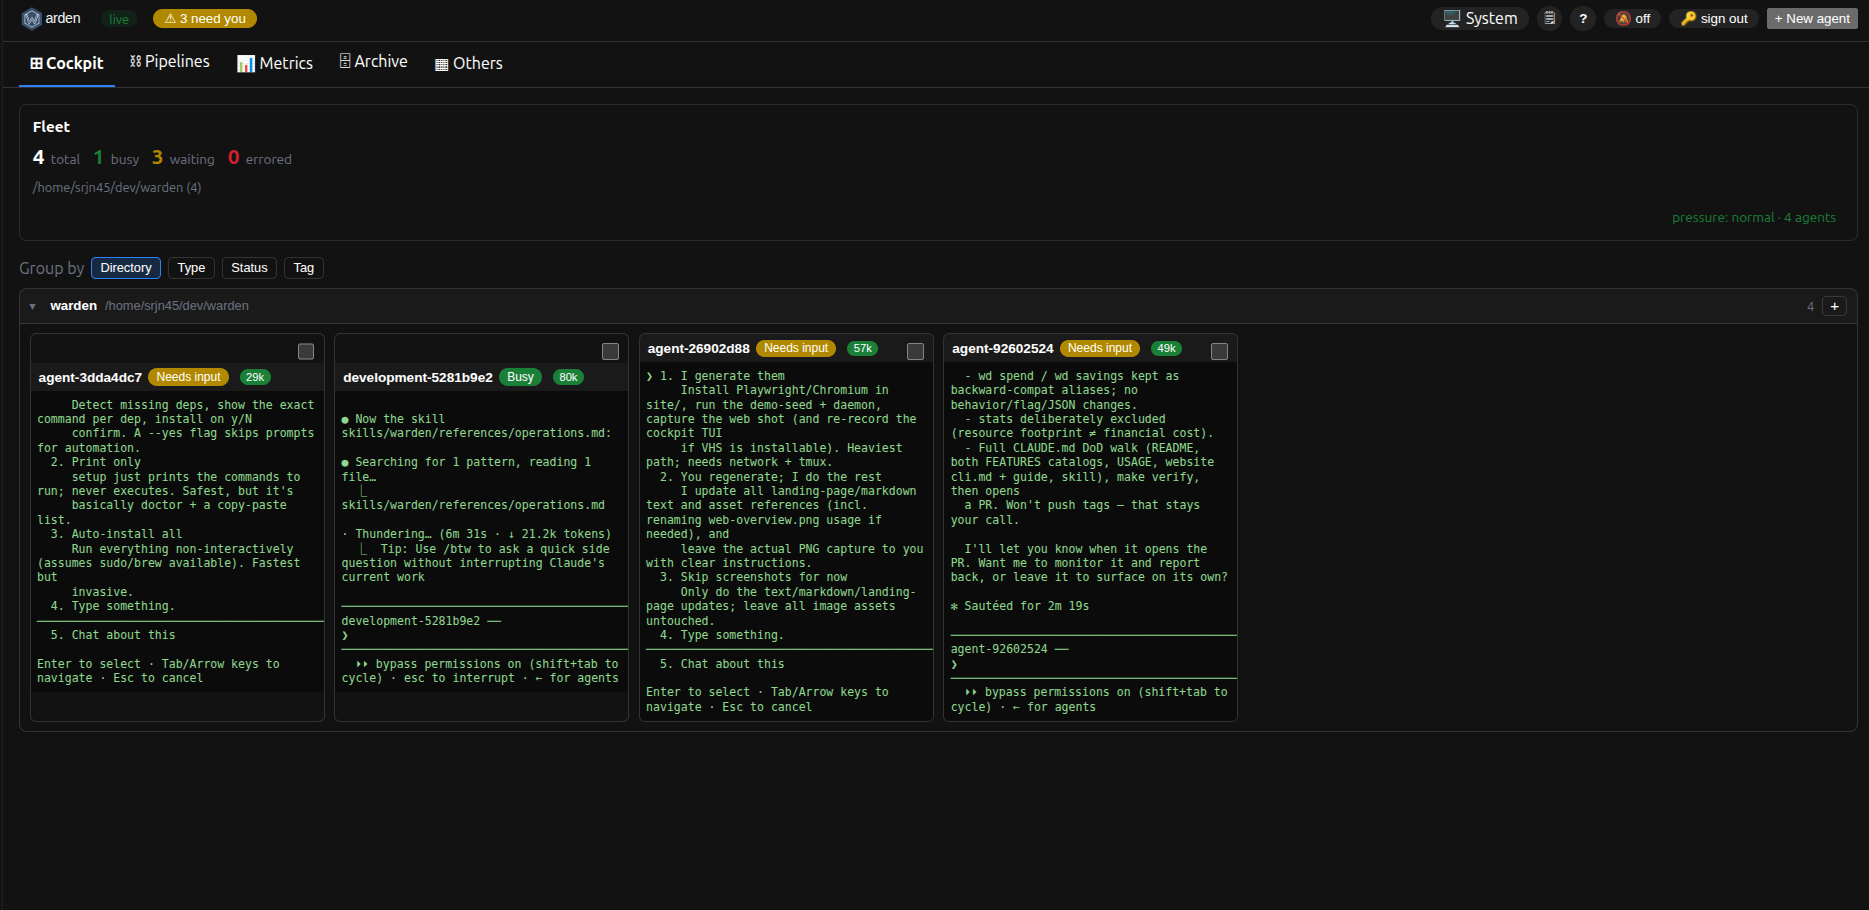
Routes & tabs
Section titled “Routes & tabs”The dashboard is a URL-routed mission-control shell. Tabs are real URLs (History-API routing — back/forward, refresh, and shareable deep links all work), not client-only state. Each surface has its own address:
| Route | Tab | What’s there |
|---|---|---|
/cockpit | ⊞ Cockpit | The home view (/ redirects here). A slim Fleet header — totals · busy · waiting · errored, pressure, per-directory counts — above the full agent grid. |
/pipelines | ⛓ Pipelines | Pipeline list + live DAG / per-job drawer. |
/metrics | 📊 Metrics | Per-agent and fleet-wide charts — see below. |
/terminals | ▷ Terminals | First-class terminal sessions (kind=terminal): a live PTY viewport plus a New terminal action. Terminals are excluded from the agent grid and all agent counts. |
/archive | 🗄 Archive | Ended sessions with since/type filters. |
/others | ▦ Others | The former Overview, renamed to a catch-all (sits last): Needs you (attention queue), File conflicts, and Recent activity. New/not-yet-homed widgets land here first. |
/agent/<id> | <id> | A pinned agent’s live terminal (one closeable tab per pinned agent). |
/tui | (top-bar ▢ TUI button) | The full warden tui, streamed full-screen — not a tab; launched from the highlighted top-bar button and exited with Ctrl+Q. See Full-screen TUI. |
/ redirects to /cockpit, so there is a single canonical home URL. Deep-linking and refresh work because the daemon serves the SPA for any non-API path.
In the Cockpit you can group the fleet by directory, task type, status, tag, or agent (the AI backend — claude/aider/…) to keep a large fleet legible:
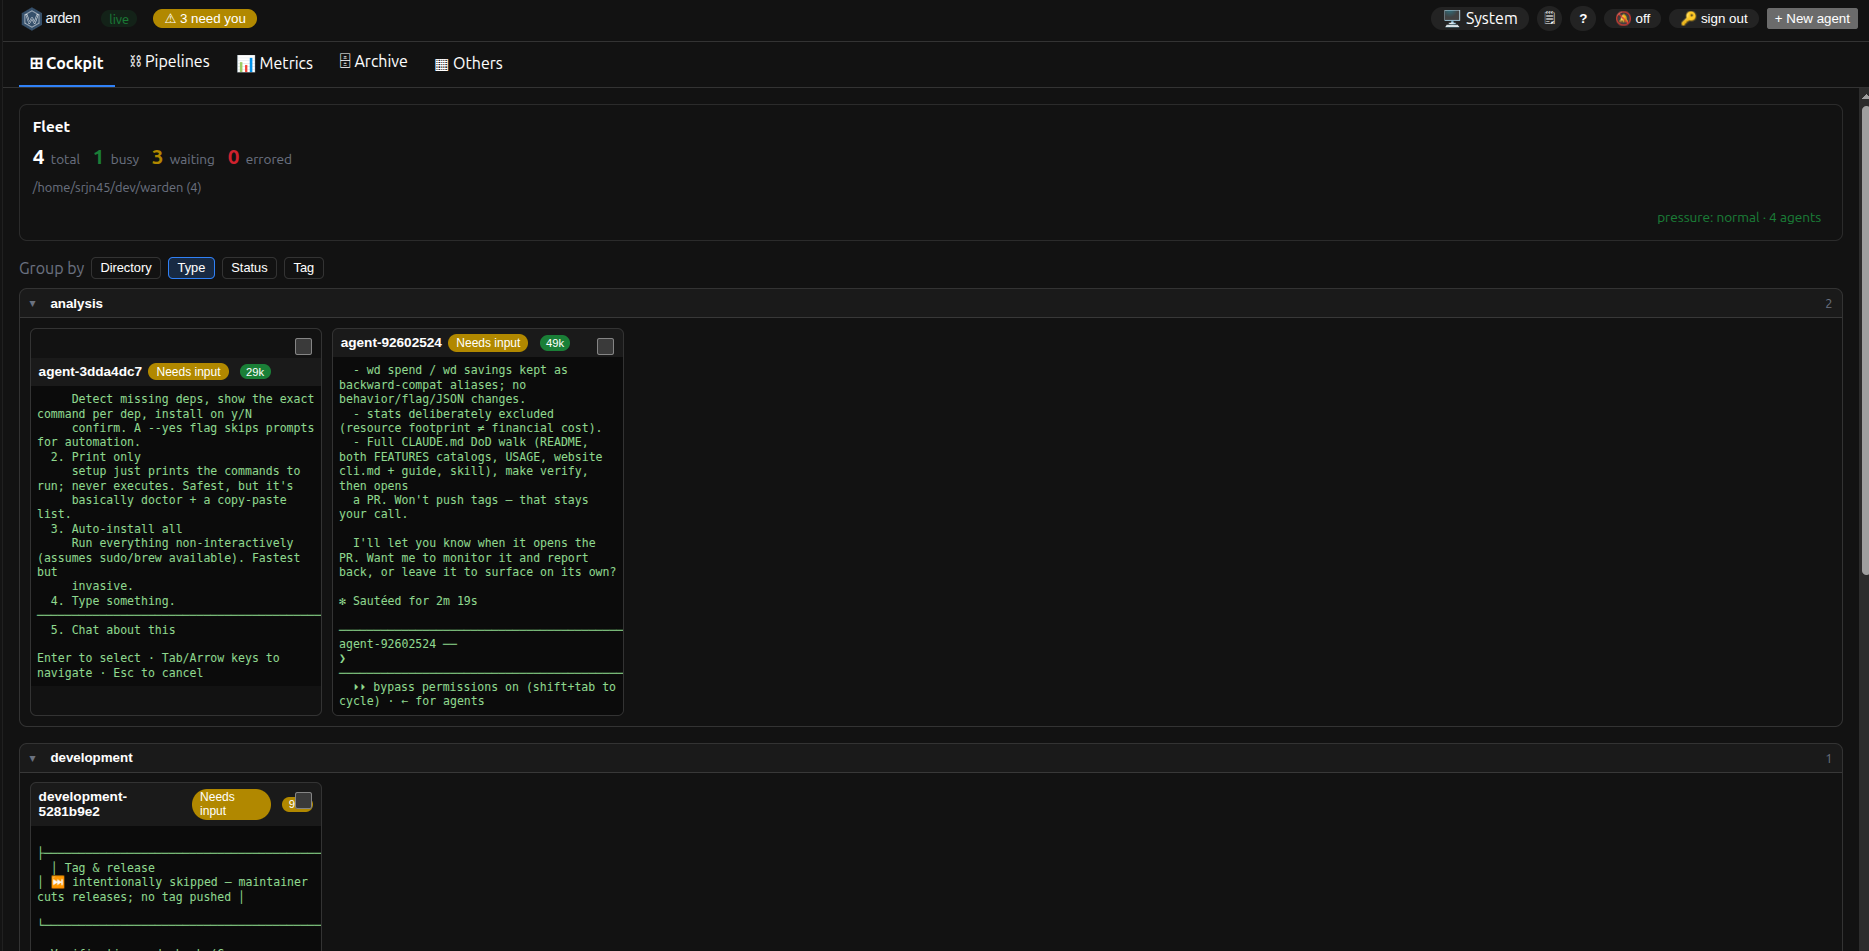
Each agent card also shows the brand logo of the backend driving it in the tile header, so you can spot claude vs aider agents at a glance. An agent with no recorded backend (anything spawned before backend selection shipped) shows as claude; an unrecognized backend falls back to a small monochrome lettermark.
What it does
Section titled “What it does”| Feature | Description |
|---|---|
| URL routing | Real History-API routes (above) — back/forward, refresh, middle-click-open-in-new-tab, and shareable deep links all work. |
| Cockpit home | The default view: a Fleet summary header above the canonical agent grid. Terminals (kind=terminal) are excluded from the agent grid and all agent counts — they live in the Terminals tab. The old Quick spawn widget and duplicate All agents mini-grid were removed. |
| Terminals tab | A /terminals tab with a live PTY viewport and a New terminal action for first-class terminal sessions. |
| Live fleet over SSE | No manual refresh; coloured busy/idle badges (Starting, Busy, Needs input, Idle, Done, Error, Orphaned) + each agent’s subject. |
| Attention queue | In the Others tab: surfaces agents in waiting_for_input/errored/orphaned, with one-click approval buttons. |
| Metrics view | A dedicated /metrics tab — see Metrics view. |
| Context & Messages overlay | Opened from a small 🗒 header button as a dismissible overlay (Esc closes); it’s no longer a tab. |
| Interactive terminal | Pin an agent to get a live tmux attach bridged to the browser over a WebSocket (xterm.js) — type into the agent and watch it respond. Mobile-friendly: swipe to scroll back through history (the swipe drives tmux/the agent’s scrollback the same way a mouse wheel does), plus a sticky on-screen key bar (Esc, Tab, Ctrl-C, ↑/↓, jump-to-bottom) for the keys a phone keyboard lacks. The layout tracks the visible viewport, so the bottom tab nav and the key bar stay put above the soft keyboard. |
| Full-screen TUI | The whole warden tui in the browser, launched from the top bar — see Full-screen TUI. |
| Create agent | + New agent prompt box with a directory picker (live prefix autocomplete) and a Supervised checkbox. |
| Terminate with git guard | Surfaces a 409 → Force + optional hard-delete when there’s uncommitted/unpushed work. |
| Digest panel | View an agent’s completion digest in the browser. |
| Browser notifications | Opt-in desktop notification when an agent enters waiting_for_input (gated to hidden tabs). |
| Group the fleet | In the Cockpit, group agents by directory, task type, status, tag, or agent (the backend driving each session) to keep a large fleet legible. |
| Backend logo on cards | Each agent card’s header shows the brand mark of its backend (claude/aider/…); empty/legacy ⇒ claude, unknown backends ⇒ a monochrome lettermark. |
| Batch operations | Select multiple agents and act on them at once (e.g. terminate / delete). |
| Search & archive | Full-text search across the fleet; browse archived (closed) agents from the Archive tab. |
| Theme toggle | Light / dark / system theming. |
| Keyboard shortcuts | Global shortcuts for navigation and actions (1–9 jump to a tab, j/k next/previous, Esc close), with a ? help overlay listing them. |
The web dashboard also has a Pipelines tab: it lists pipelines, shows a selected pipeline’s jobs as status-colored cards with dependency chips, and a per-job drawer with the prompt/handoff/output, a Cancel (pipeline) / Retry (job) control, and an Open terminal link to a running job’s session. (Creating / editing pipelines in the browser is not yet available — use warden pipeline create <spec.yaml> or -f.)
Full-screen TUI
Section titled “Full-screen TUI”The highlighted ▢ TUI button in the top bar opens the full terminal cockpit
— the literal warden tui (/tui) — streamed full-screen into the browser,
so you can drive the entire fleet from a laptop exactly as you do locally. It
isn’t a tab: it takes the whole viewport, edge-to-edge and non-scrollable,
with none of the dashboard chrome, and you exit with Ctrl+Q from any pane
(which lands you back on the home view).
It isn’t a reimplementation. The daemon builds a shared three-pane tmux cockpit (a control pane — the navigator tree of Approvals · Pipelines · Agents · Terminals — a terminal pane showing a live terminal session, and an agent pane that opens the selected agent) and bridges it to an xterm.js terminal over the same WebSocket PTY that powers a per-agent attach. Because it’s the real session:
- Every TUI keybinding works —
enteropen ·nnew ·odir ·ssend ·aattach ·iinfo ·xkill ·rrefresh ·?help ·j/k,g/G, Alt+Arrow to move between panes, and the rest — they reach the cockpit unchanged. (Ctrl+Q is the one chord held back by the browser, to exit.) - The shells are real shells. The terminal pane runs a live terminal session
(
kind=terminal) — your$SHELLwith your rc files — so tab-completion, autosuggestions, history, and fzf all behave as they do locally — nothing is emulated, only piped. qexits the TUI to the dashboard. Pressingqin the top-left control pane tears the whole cockpit down and returns you to the home view — exactly as it quits the cockpit locally. It’s pane-scoped:qonly exits from the control pane (where it means “quit”); in the terminal pane or the agent pane a literalqtypes normally. Ctrl+Q still exits from any pane. Re-open the TUI from the ▢ TUI button — the cockpit is rebuilt fresh.- The agent in the agent pane is the real agent (e.g. Claude Code), with its full interactive UI. Shift+Enter is mapped to its newline.
- Shared across clients. There’s one web cockpit; the most-recently-active client drives the window size.
- Self-healing. The cockpit lives in the tmux server, not the daemon, so it
outlives daemon restarts and reinstalls. Before reusing an existing session the
daemon checks it still has the right shape — three panes, with the top-left control
pane genuinely running
warden tui --pane=control— and silently kills and rebuilds a wedged one. You always land on a healthy cockpit, no manualtmux kill-sessionrequired. To force a fresh rebuild yourself, runwarden tui --rebuild-web-cockpit(then reload the/tuiview).
It’s built lazily on first attach and reused after that. While the terminal has
focus the dashboard’s global single-key shortcuts stay dormant (keys flow to the
TUI). The one place a browser can’t match a local terminal is a handful of
browser-reserved chords (Ctrl+T/Ctrl+W/Ctrl+N) — installing the dashboard
as a PWA reclaims most of them. This is a desktop/laptop surface — the
three-pane cockpit wants width, so there’s no mobile key bar; on a phone, pin a
single agent (above) instead.
Metrics view
Section titled “Metrics view”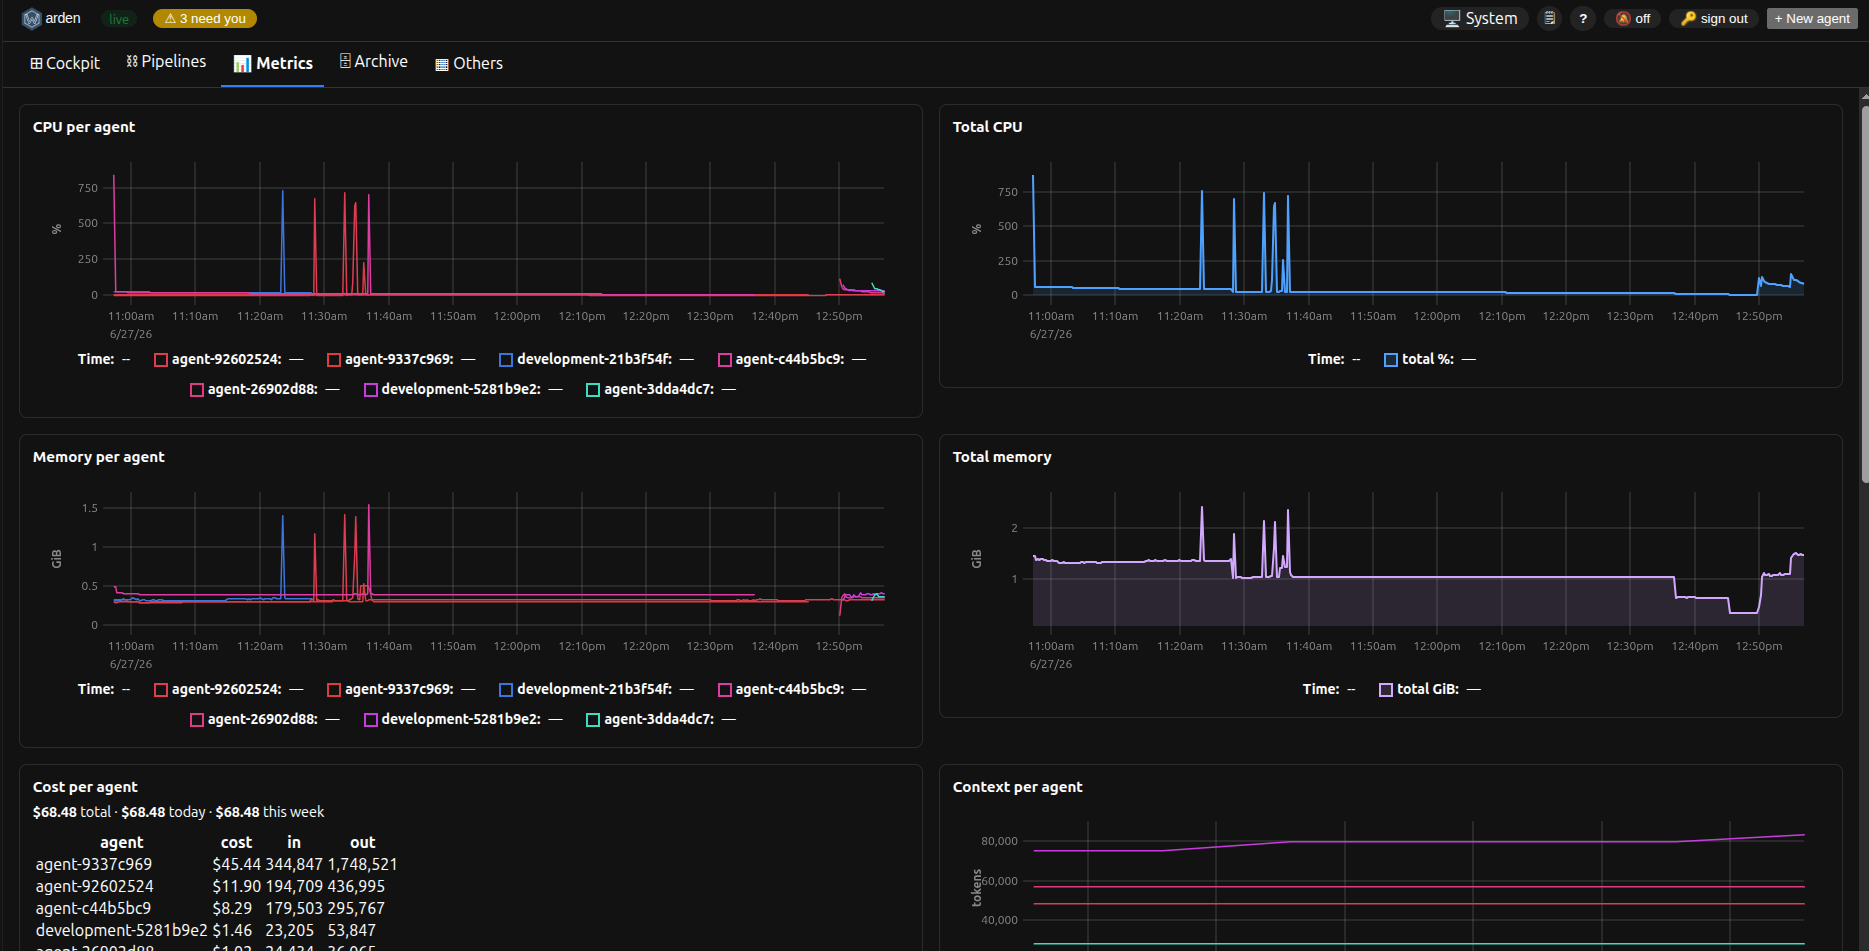
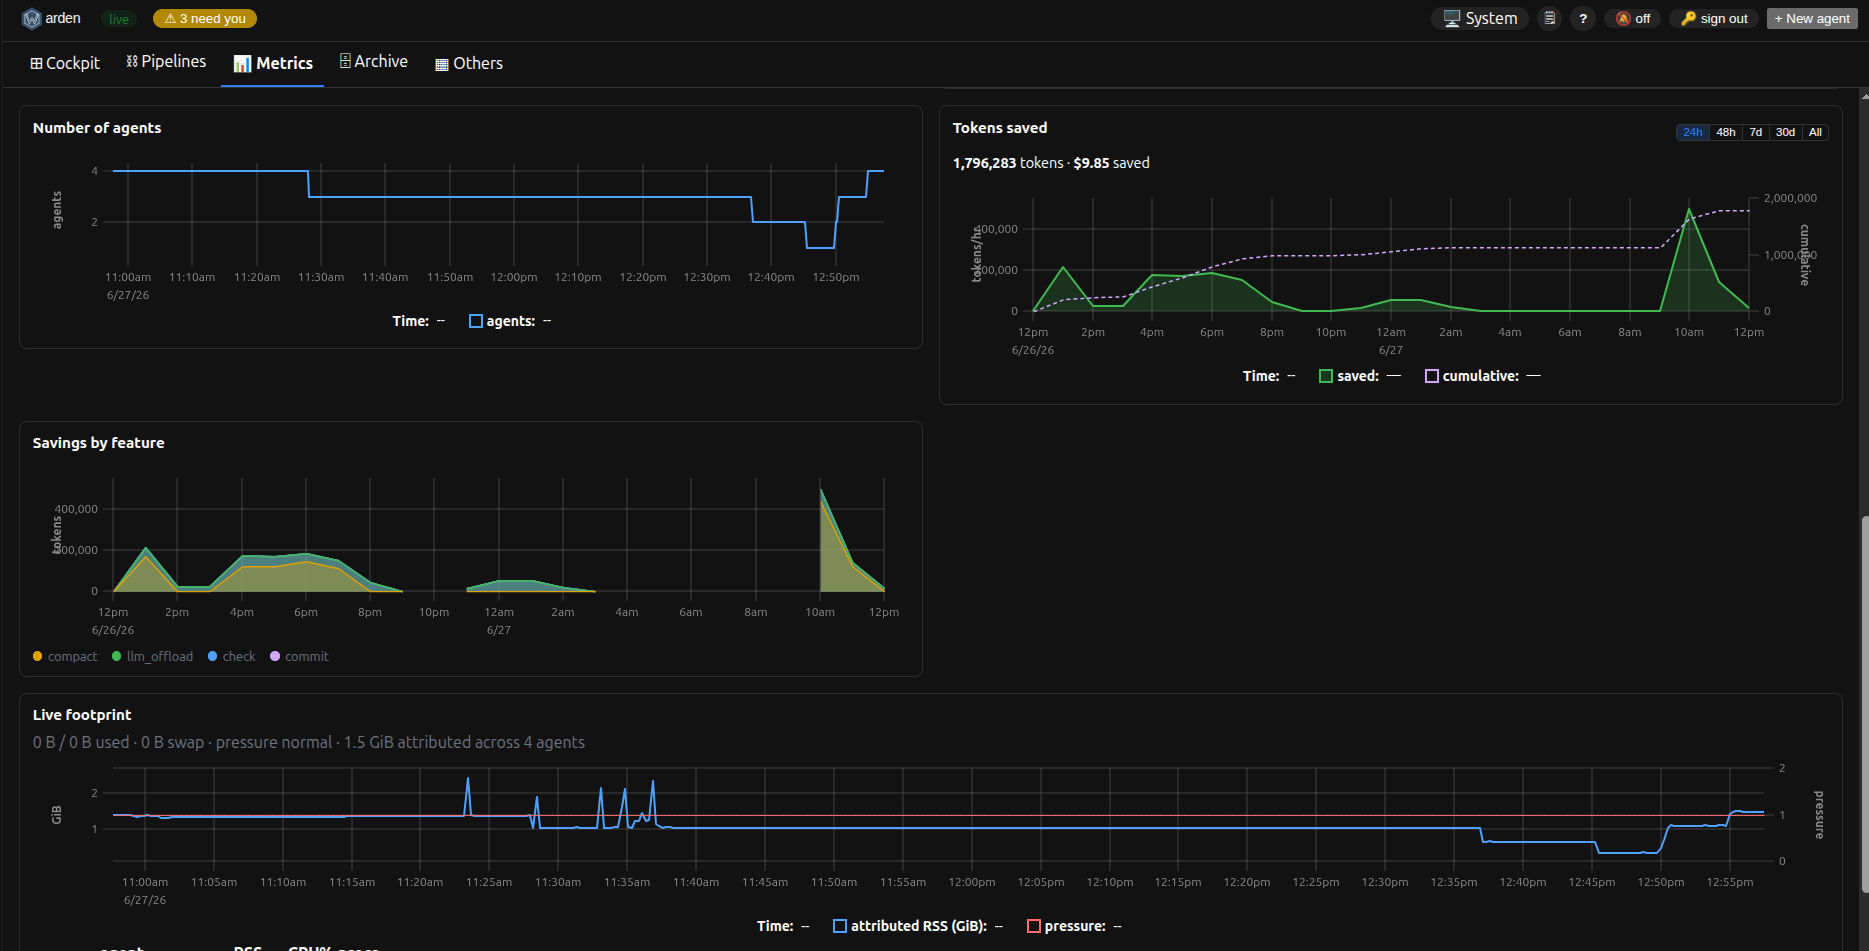
The Metrics tab (/metrics) is a responsive grid of self-contained uPlot chart cards — two columns on wide screens (each per-agent chart sits beside its fleet-wide total), collapsing to a single column on phones:
| Card | What it shows |
|---|---|
| CPU per agent | One line series per live agent, cpu_percent over time (from the metrics history store). |
| Total CPU | A single fleet-wide line: cpu_percent summed across all agents per sample. Sits beside CPU per agent. |
| Memory per agent | One line series per agent, resident memory in GiB over time. |
| Total memory | A single fleet-wide line: resident memory (GiB) summed across all agents. Sits beside Memory per agent. |
| Cost per agent | A total · today · this week dollar headline over a sorted per-agent cost bar chart — the top-N costliest agents (rest folded into an others row), each bar’s measured $ cost with its input/output token counts on hover — from the cost-governance rollup (warden usage spend). |
| Context per agent | One line series per agent of its live context-window fill over time, with the legend dot coloured by ok/warning/critical. This series is accumulated client-side (a ring buffer over the live SSE feed) — it survives tab switches but starts fresh on a full page reload (a persisted history is a tracked daemon follow-up). |
| Number of agents | Fleet size (agent_count) over time. |
| Tokens saved | The saved-tokens trend (from the savings ledger) with a window picker — 24h/48h bucket by hour, 7d/30d/All by day — so a fresh ledger still plots a real curve instead of a single point. A filled area shows tokens saved per bucket against a left axis, and a dashed line shows the running cumulative against the right axis, plus a headline saved-tokens / dollars figure. The trend is zero-filled, so idle intervals read as real zeros rather than gaps. If the ledger is disabled (savings: false) the card shows a “set savings: true” hint instead of an empty chart. |
| Savings by feature | A per-feature stacked-area breakdown of the same trend — which lifecycle feature (llm_offload, commit, check, compact) drove the savings — over the selected window. |
| Live footprint | The former Resources panel — live per-agent + system resource charts. |
Build & run
Section titled “Build & run”make release # 1. builds the Astro UI (web/), 2. embeds it via go:embed, 3. builds bin/wardenwarden daemon # start the daemon as usualThen open http://localhost:8765 in a browser.
The UI is baked into the binary at build time. After changing anything under
web/, rebuild (make release, ormake uifor the frontend only) and restart the daemon. For live UI iteration, runwarden daemonandmake ui-devin parallel and openhttp://localhost:4321— the Astro dev server proxies/api/*(the whole REST surface, incl. the/api/v1/sessions/{id}/attachand/api/v1/cockpit/attachWebSockets and/api/v1/events/streamSSE) and/healthzto:8765, so SSE and all REST calls work without CORS configuration.